User Guide & Support — XLSurveySlicer Lite
User Guide & Support — XLSurveySlicer Lite
Last Updated: May 12, 2026
User Guide
- Your Survey Data: Open your survey data collected through Google Forms™ (it will appear in the sheet named “Form Responses 1”).
- One File per Study: Use one Google Sheets™ file for one survey study only. If you want to analyze another survey, create and use a separate file.
- Setup: Setup may take a short while depending on your dataset size. Once it’s done, you’re ready to generate tables instantly.
- Creating Tables: You can create tables anywhere in your Google Sheets™ — either in a new sheet or in any additional sheet you create. Tables will start from the active cell.
- Summary and Crosstab Tables: To create summary tables, select one or more questions from the Question checkbox list. To create crosstabulations, select one or more questions from the Across checkbox list. You can also apply filters at up to three levels.
- Filters : If you choose multiple options from the same question, they are combined as OR. If you apply filters from different questions, they work together as AND. If the same question is used in more than one filter level, the most recent selection replaces the earlier one.
- Calculation Basis: Choose whether percentages are based on all respondents or only on those who answered the question (excluding blanks).
- Display Mode: You can choose to show results as percentages or counts, depending on your reporting needs.
- Automatic Updates: When new responses are added to your Google Forms™ form and therefore appear in the sheet “Form Responses 1”, XLSurveySlicer Lite automatically updates your dataset when you open the sidebar.
- Check Comma Usage: XLSurveySlicer Lite uses commas (,) as delimiters for multiple answers in checkbox-type questions. Before running XLSurveySlicer, make sure that commas in single-choice questions are removed in the “Form Responses 1” sheet to ensure accurate results.
- Compatibility: You’re not limited to Google Forms™ — you can use any data-collection tools. Just export your data into Google Sheets™ following the Google Forms™ response layout in a sheet.
- Text Data : In fact you’re not limited to just survey data. XLSurveySlicer Lite works with any text-based data in your spreadsheet. Product categories, feedback tags, status labels — and more.
- Dataset: As a rule of thumb, XLSurveySlicer Lite can handle datasets up to 10,000 respondents/rows, depending on the number of columns in the data.
- Numeric Data: XLSurveySlicer Lite does not generate tables for open numeric fields (such as age, price, or rating entered as free numbers). To analyze numeric responses, consider grouping them into ranges or converting them into categories.
- Quality of Raw Data: XLSurveySlicer Lite helps you create tables quickly, but the quality of your insights depends on the quality of your raw data. If you notice unusual or unexpected figures, always check your raw data first.
- Deletion of Responses: This feature works only if Column A in your survey data sheet contains a unique ID (number, text, or alphanumeric). Because Google Forms™ uses timestamps in Column A by default, you would need to replace those timestamps with your own unique IDs if you want to use this feature. Alternatively you can use Full Data Reset.
- Just Start Fresh: If you want to restart with a different dataset, use Full Data Reset, then prepare your new survey data in sheet “Form Responses 1”. XLSurveySlicer Lite will rebuild everything in just a few clicks.
- Important – Do Not Edit System Sheets: Do not rename or edit the hidden system sheets (M1, N2, U5, C0, C1, D3, L4) created by the add-on. These sheets are added by XLSurveySlicer Lite during setup to help analyze survey data. Modifying them may cause errors or break the add-on.
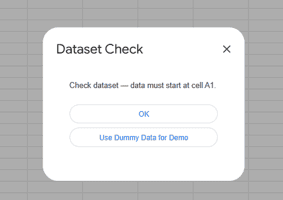
- Start Exploring with Dummy Data : If your worksheet does not contain any data yet, this pop-up will appear after clicking Prepare Data and Open Sidebar. Choose Use Dummy Data to start exploring XLSurveySlicer Lite right away.
Support
For any questions, technical issues, or license-related inquiries please contact:
[email protected]
Google Forms™ and Google Sheets™ are trademarks of Google LLC.