
Pivot Tables For Survey Data In Excel
XLSurveySlicer
by Maxi Research
While XLSurveySlicer Lite handles text-based data analysis in Google Sheets™—surveys, categories, tags, and more—XLSurveySlicer is the full Excel version designed specifically for survey, with the ability to analyze both text and numeric data, plus text-coding tools for open-ended responses
An Excel Add-In
For Excel for Windows only
Free Trial
XLSurveySlicer is Pivot Tables made for survey data in Excel.
It transforms Excel into a powerful survey analysis tool, going beyond what native Pivot Tables can do. While Pivot Tables work well for structured data, XLSurveySlicer is built to handle open-ended survey answers, with simple and practical text-coding tools that Excel does not provide by default. This makes it easier to organize and interpret unstructured responses for deeper insight.
XLSurveySlicer can also handle multiple values within a single cell, separated by commas — including open-ended comments where different phrases in a sentence are appropriately separated by commas. This allows meaningful analysis without manual reformatting.
The add-in works with survey data from Google Forms or other tools, as long as the data is structured like Google Forms responses in Excel.
Built for students, researchers, freelancers, and consultants, XLSurveySlicer delivers fast, reliable results, making survey data analysis effortless. With just a few clicks, you can turn raw responses into summary tables and crosstabulations, ready for charts, reports, or deeper analysis.
No need for sophisticated statistical software like SPSS for many everyday survey analysis tasks — just use Excel already on your PC or laptop.
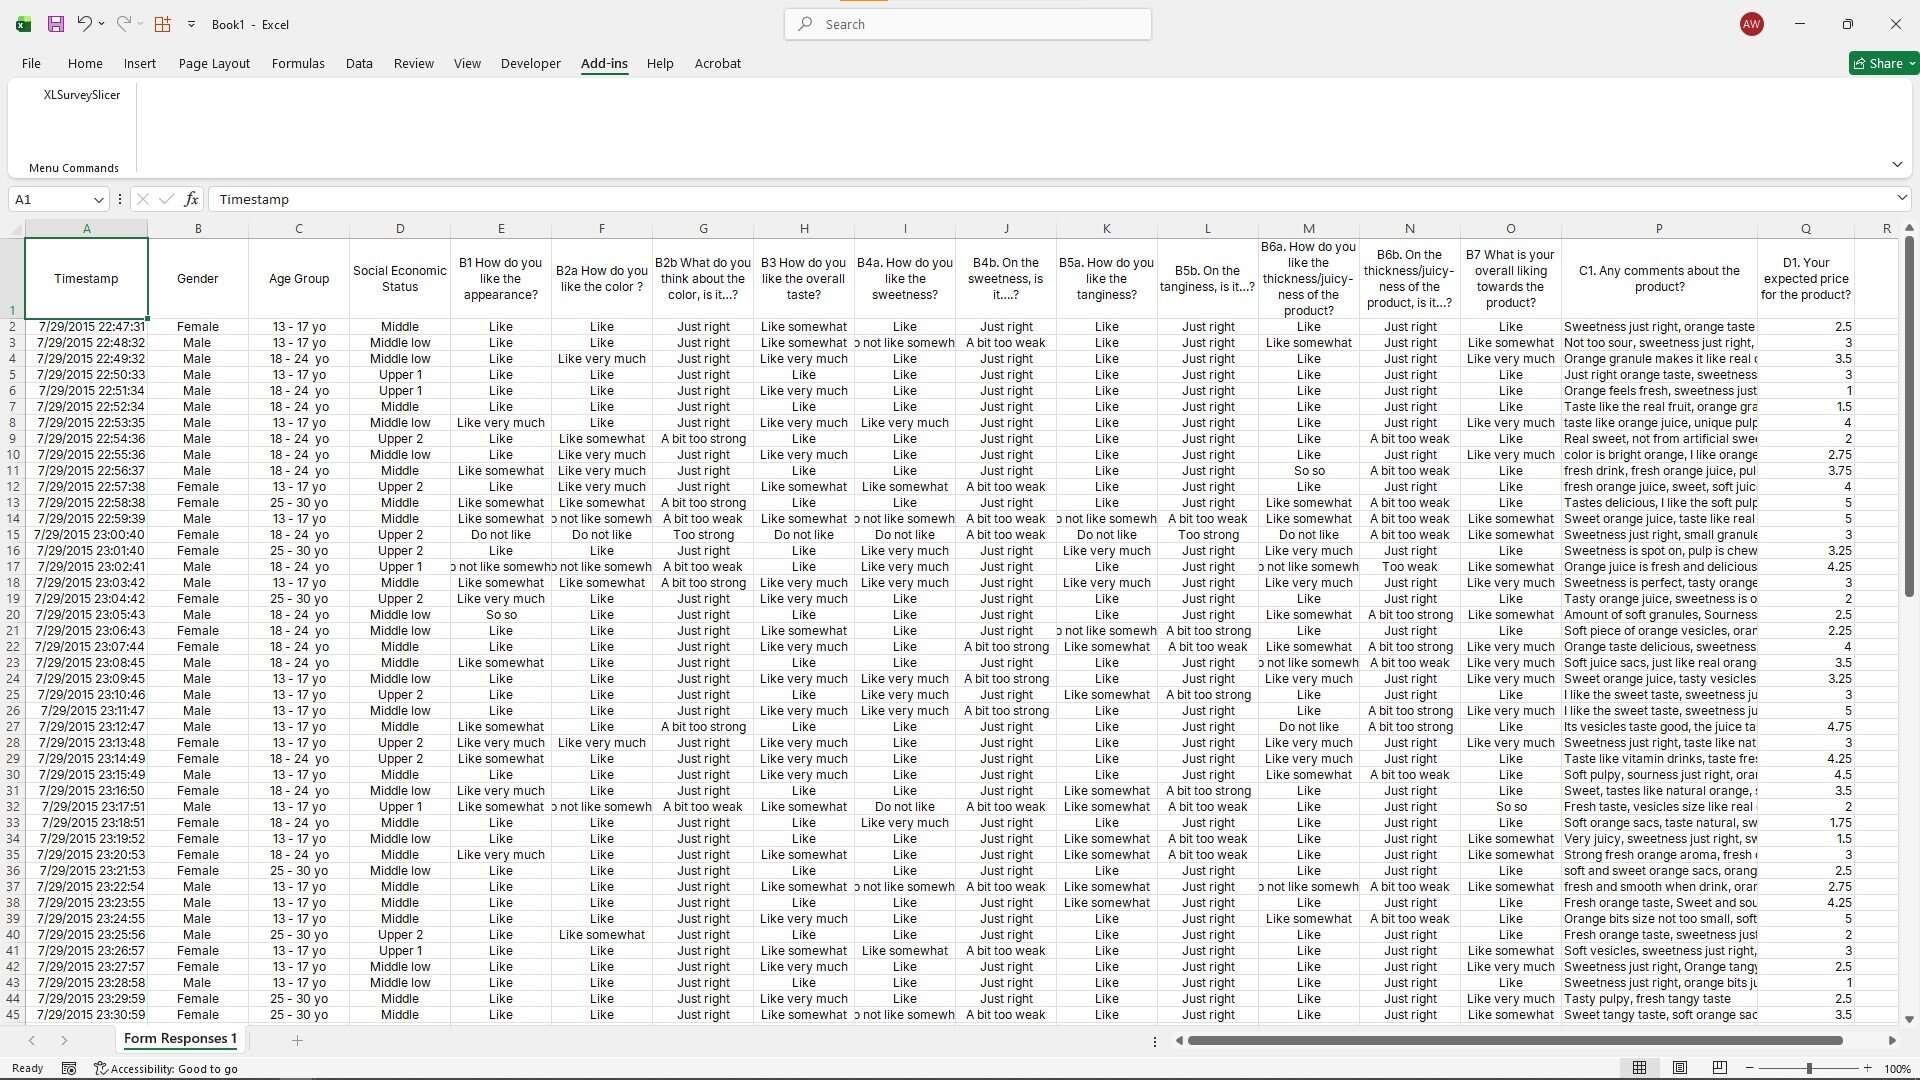
In your Excel, go to Add-In → XLSurveySlicer
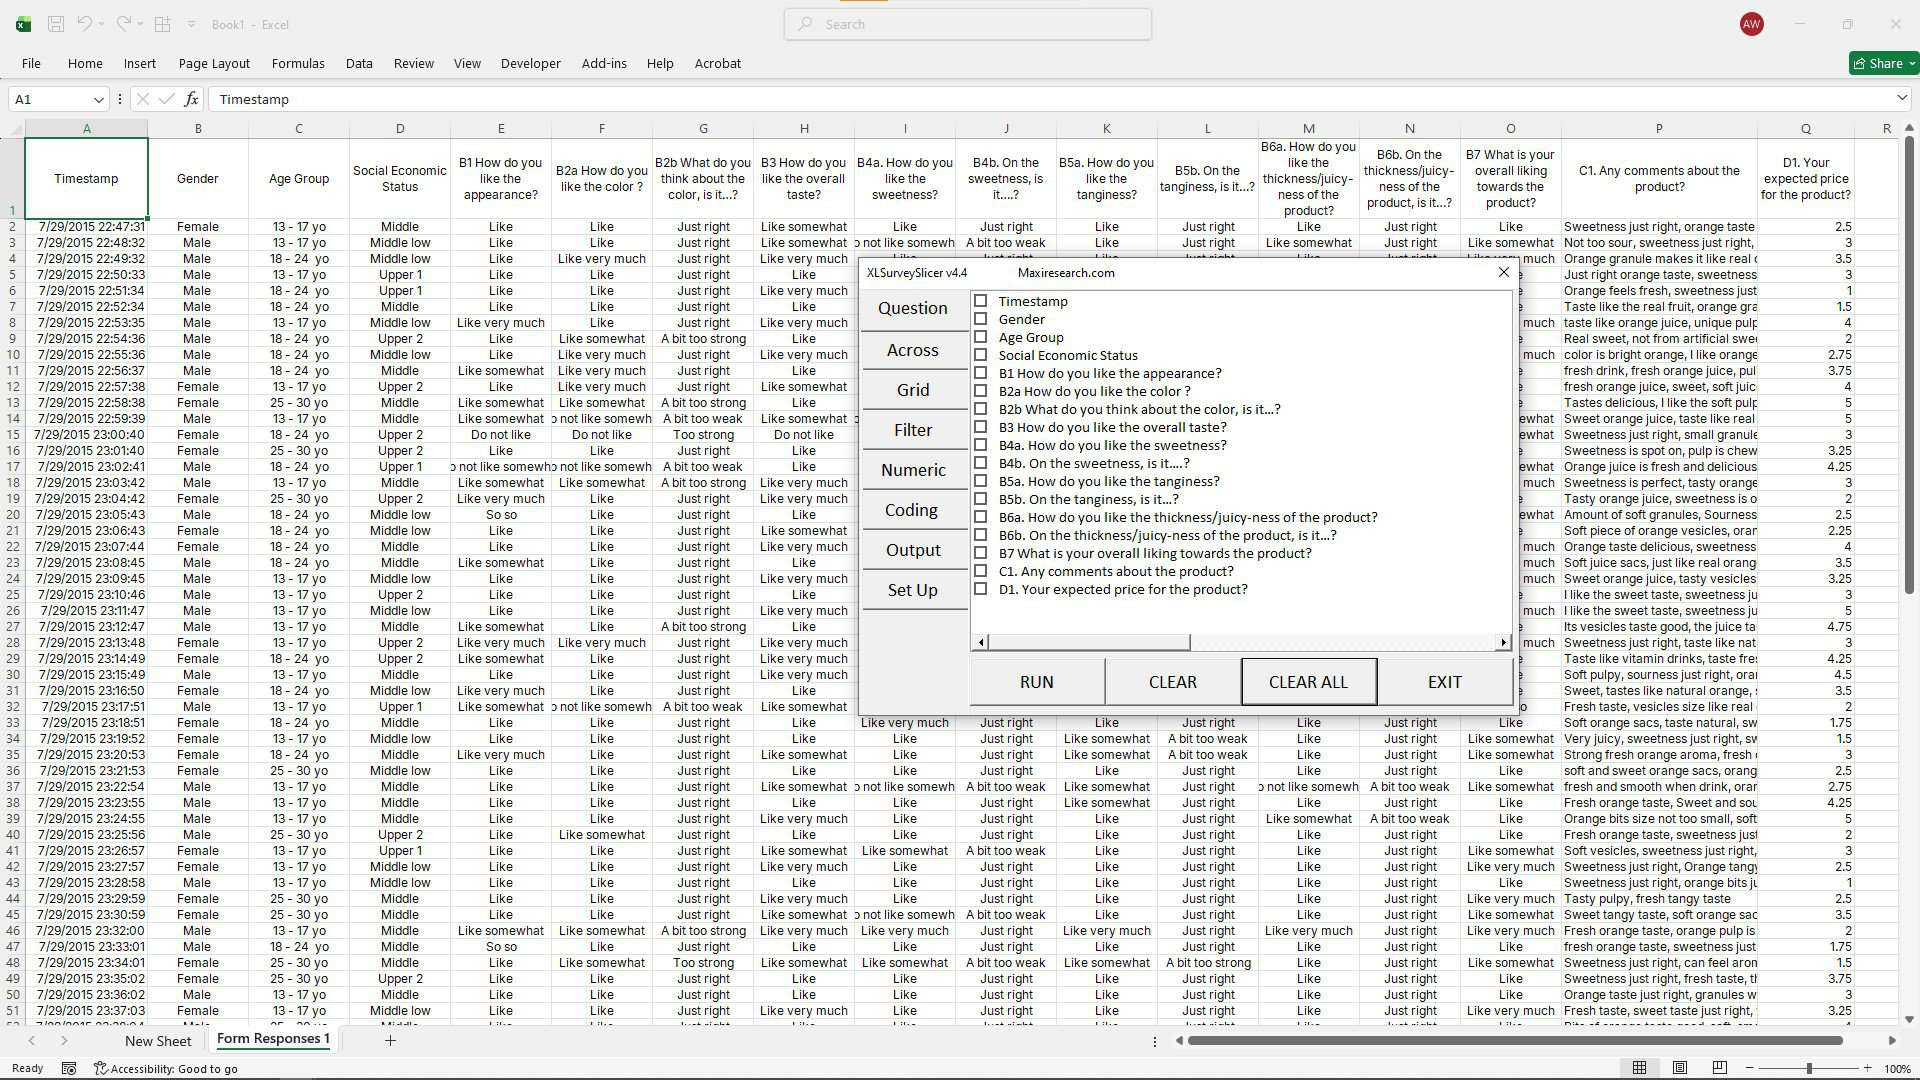
Prepare your data and open the XLSurveySlicer
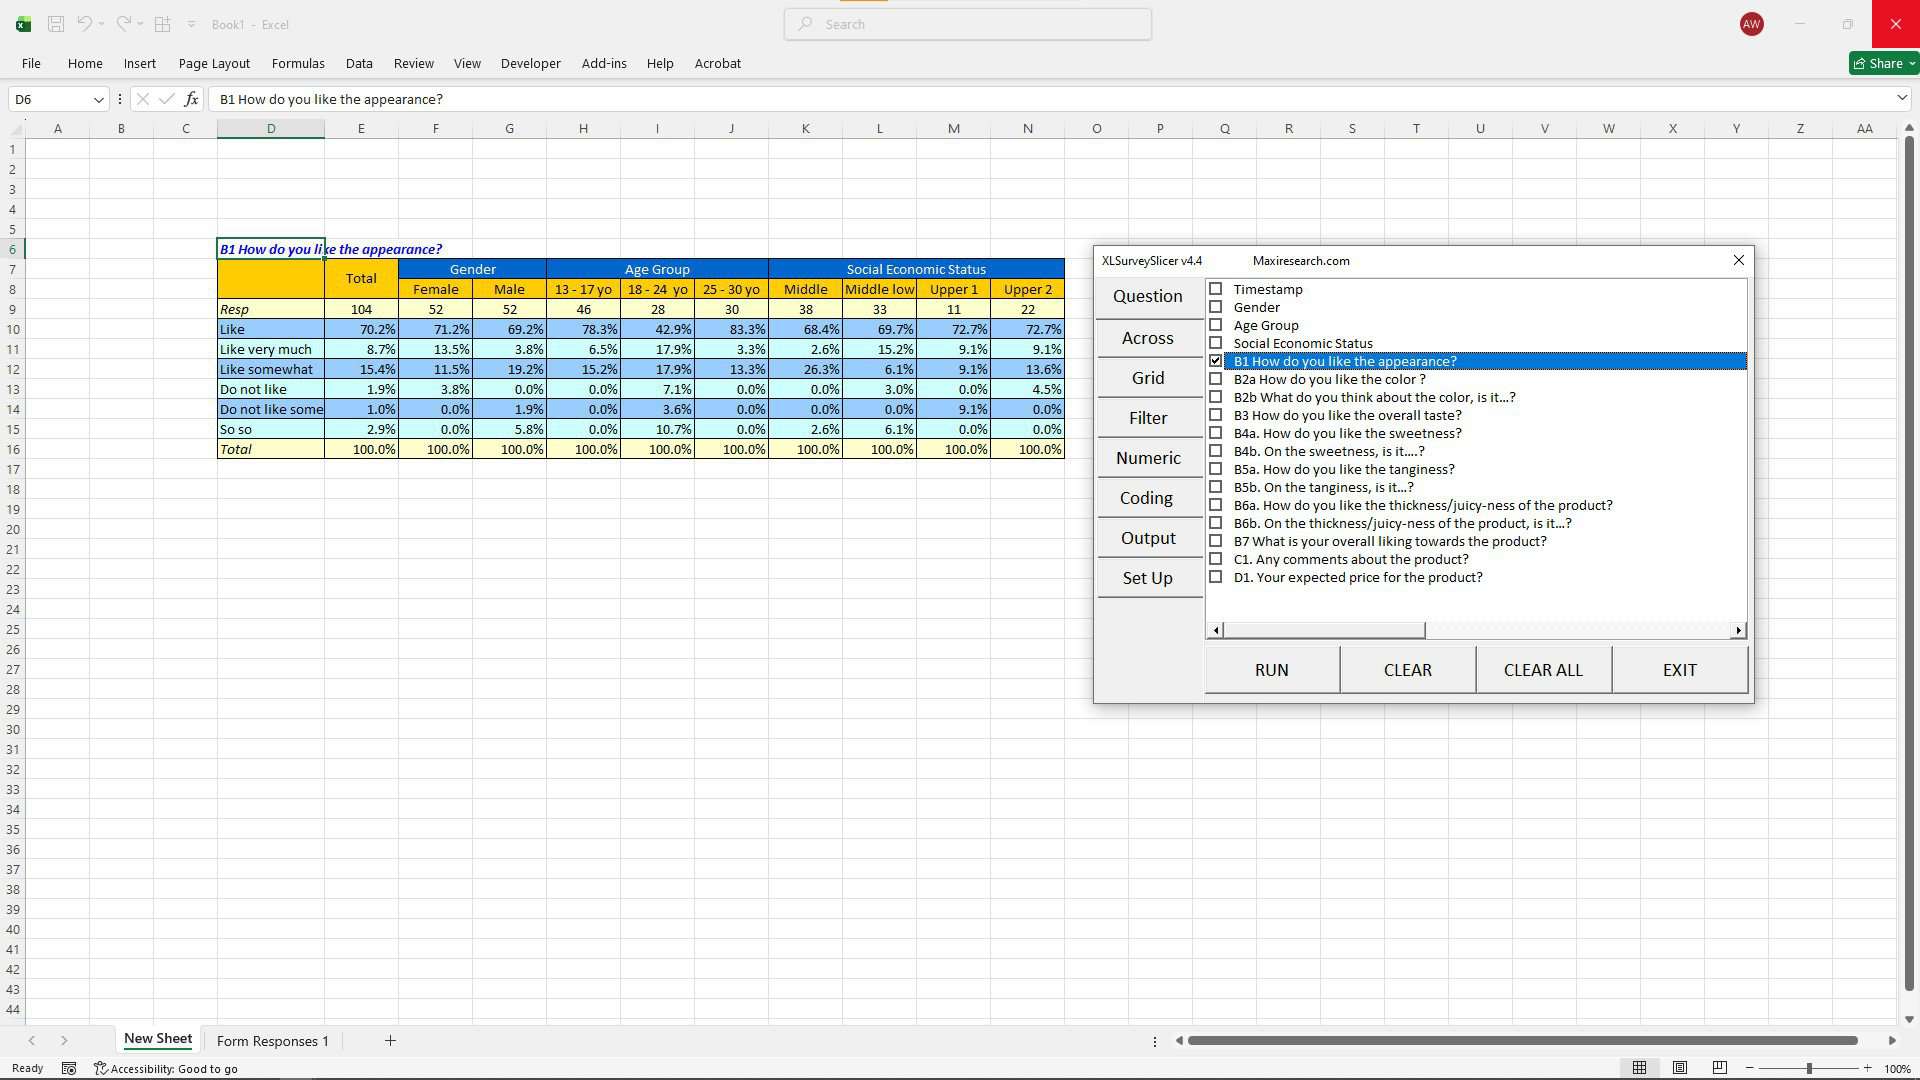
Select questions and click Run to Generate Tables
See XLSurveySlicer in action
- Try XLSurveySlicer free for 30 days.
- After the trial ends, you can not generate tables
- To keep using everything permanently, you can purchase a lifetime license:
- $149 – One-time purchase, no subscription.
Terms of Service — XLSurveySlicer
Last Updated: November 30, 2025
XLSurveySlicer is an Excel Add-In developed by Maxi Research that helps users create summary tables and crosstabulations from survey data.
- Acceptance of Terms
By installing or using XLSurveySlicer, you agree to these Terms of Service. - License and Usage
- The add-on includes a free 30-day trial with full features.
- After the trial ends, the add-in will no longer be able to generate tables..
- A valid license key is required to re-enable full features.
- License Purchase
- XLSurveySlicer is available as a one-time purchase lifetime license:
- Lifetime license: $149 USD (no subscription)
- License Key
- Issued after successful PayPal payment.
- Delivered to the email address used during checkout.
- Can be activated once.
- An unused key may be transferred to another person.
- Once activated, a key cannot be used on any other account.
- Prohibited Actions
You agree not to:- Circumvent, bypass, or reverse-engineer the license verification system.
- Modify, delete, or unhide sheets created by the add-on for internal processing (doing so may cause the add-on to malfunction).
- Resell, share, or redistribute an activated license key.
- Use the add-on in automated systems or bots.
- Payment and Refunds
- All payments are processed securely by PayPal.
- No refunds are provided after the license key has been issued, except where required by law.
- You are responsible for any PayPal fees or currency conversion costs.
- Disclaimer of Warranty
The add-on is provided “as is” without warranties of any kind.
We do not guarantee accuracy, completeness, or suitability for any specific purpose. - Limitation of Liability
Maxi Research is not responsible for:- Data loss, corruption, or spreadsheet errors
- Indirect, incidental, or consequential damages
- Losses caused by downtime, bugs, or service interruptions
- Termination
We may suspend or terminate your access if you violate these Terms. - Changes to Terms
We may update these Terms from time to time.
Continued use of the add-on after updates indicates acceptance of the revised Terms. - Governing Law
These Terms are governed by the laws of Indonesia. - Contact
For questions or support please contact:
[email protected]
Privacy Policy — XLSurveySlicer
Last Updated: November 30, 2025
XLSurveySlicer is an Excel Add-In developed by Maxi Research. This policy explains what information we do and do not collect, how license verification works, and how your data is handled.
- Information We Do Not Collect
We do not collect, store, or share:- Survey data
- Spreadsheet content
- Personal user details
XLSurveySlicer does not require an internet connection to operate.
The only time the add-in connects online is when verifying your license key.
All data processing happens entirely within your Excel workbook.
Your data never leaves your Excel.
- License Verification
To enable full features, the add-on sends only the license key you enter to our verification server.
No personal information (name, email, IP, etc.) is sent.
The server:- Stores each license key issued through PayPal, along with the email address associated with the purchase
- Records the activation status of each key (activated or not)
- Uses this information solely to verify license validity and manage activations
- Does not collect or track any other user data.
All communication is encrypted using HTTPS (TLS 1.2 or higher).
- Payments are processed securely by PayPal. We do not receive or store any credit card details.
We only receive:- Confirmation of purchase
- The PayPal email used to buy the license key
- No Tracking
XLSurveySlicer does not:- Track usage behavior
- Log activity
- Use cookies
- Collect analytics
- Data Security
Because no personal data is stored, there is nothing to leak or breach.
No user data is retained on our server. - Changes
We may update this policy from time to time.
Continued use of the add-on after updates indicates acceptance of the revised Terms. - Governing Law
This policy is governed by the laws of Indonesia. - Contact
For questions or support please contact:
[email protected]
User Guide and Support — XLSurveySlicer
Last Updated: November 30, 2025
User Guide
- One Survey per Workbook/Excel file: Each workbook (or Excel file) should contain only one survey data set. If you need to analyze other survey data, you should use a separate workbook.
- Survey Data Set Up: Your survey data is located on a single sheet within the workbook. The data should start in cell A1, with the first row containing the questions and the first column containing the respondent IDs (or a Timestamp that can serve as an ID). Each intersecting cell holds the answer to a specific question from a particular respondent. When XLSurveySlicer is first activated, it will automatically rename the sheet to “Form Responses 1.”
- One Cell Data : Answer for any question type—whether single answer, multiple answers, or open-ended—are recorded in a single cell, regardless of the length of the response. For multiple answers, separate each answer with a comma.
- AI-Assisted Data Cleaning: Before creating tables, AI may be needed to clean the data, especially for open-ended questions. Copy the data from the relevant column, paste it into an AI tool with specific instructions/prompts, and then paste the cleaned data back into the survey data column. This AI data cleaning process may require multiple attempts, with adjustments to the prompts and careful double-checking, until the results are satisfactory.
- Initial Run: On the first run, XLSurveySlicer will automatically code all text data within the survey. This process may take a few minutes, depending on the size of your survey data.
- Generating Tables: After coding is complete, you can directly generate the data tables you wish to create on a new sheet.
- Tables Essentials: XLSurveySlicer is equipped with cross-tabulation, filtering functions, and basic statistics like averages and standard deviations for in-depth data analysis, similar to Pivot Table.
- Organize and Code Data: The results of automatic text data coding by XLSurveySlicer may require further processing, such as organizing the coding order, combining multiple codes, or separating previously combined codes. Additionally, XLSurveySlicer can also code numeric data
- Post-Analysis Data Cleaning: More data cleaning may be necessary after reviewing the results. You can update the survey data on a particular question in specific data column using cleaned data.
- Saving Your Work: When you save the workbook, XLSurveySlicer will retain the latest arrangements, ensuring your data and analysis setup are preserved.
- Sharing Your Work: Your work, including its arrangements, can be shared with other XLSurveySlicer users. Simply send the file to another XLSurveySlicer user, allowing them to create tables based on your saved configurations.
- Just Start Fresh : If you want to restart with a different dataset, use Reset button, then prepare your new survey data in sheet “Form Responses 1”. XLSurveySlicer will rebuild everything in just a few clicks.
Support
For any questions, technical issues, or license-related inquiries please contact:
[email protected]